
Remember when that obscure local crime story you covered went viral on Reddit?
Or when you accidentally added a 0 to your Google ad spend for a day?
Your traffic probably went through the roof. (And it wasn’t the first time.)
Wouldn’t it be nice to look at your GA4 dashboard and know – without cross-referencing an outside resource (like the sticky note on your desk: “REDDIT VIRAL TRAFFIC JULY 3, 2022) – what caused those spikes?
Now, thanks to a new GA4 feature, you can.
Annotations on Google Analytics 4
Annotations allow users to add notes directly to Google Analytics 4 reports, making it easier to record events, explain changes in data, or highlight key observations for yourself and your team.
If you’re thinking, “Wasn’t this available in Universal Analytics?”
The answer is yes.
If your follow-up question is, “Why did it take so long for Google to add this to GA4?”
The answer is 😶.
SIGN UP: Digital Strategy Newsletter
Why Use Annotations in Reports?
Now that we have answered, “Can you add annotations in GA4?”, it’s time to discuss why you would.
- Traffic spikes (like the above examples)
- Your server went down, and traffic tanked (hopefully not!)
- Website redesigns
- New employee in prominent position starts/leaves
- You got penalized by Google search for using a ton of AI-generated garbage content (I know – you would never)
- You turned on/off a significant ad spend
- You launched a newsletter
…and the list goes on.
While you don’t want your reports full of annotations, you do want to know at a glance when there was a major event or strategy change that could affect your traffic.
Important Things To Know About Annotations
- You must have Administrator or Editor access to the property to add annotations. (As a Marketer, Analyst or Viewer, you may view annotations but not add them.)

- You can make up to 1,000 annotations per property.
These should be pretty significant traffic-affecting occurrences, so if you’re doing more than one or two a month on average, you might want to be more judicious. - These can only be added to Reports – not Explorations.
- You can select a single date or a date range.
- You can only annotate line graphs (i.e., no bar charts or scatter plots).
How To Add Annotations in GA4
I’ll walk you through a recent annotation we made for a client so you can see how to do this on your dashboard.
SIGN UP: Digital Strategy Newsletter
1. In Google Analytics, click Reports on the left.

2. Select the report in the left sidebar you want to annotate and right-click anywhere on a line graph.
3. Click Add annotation.

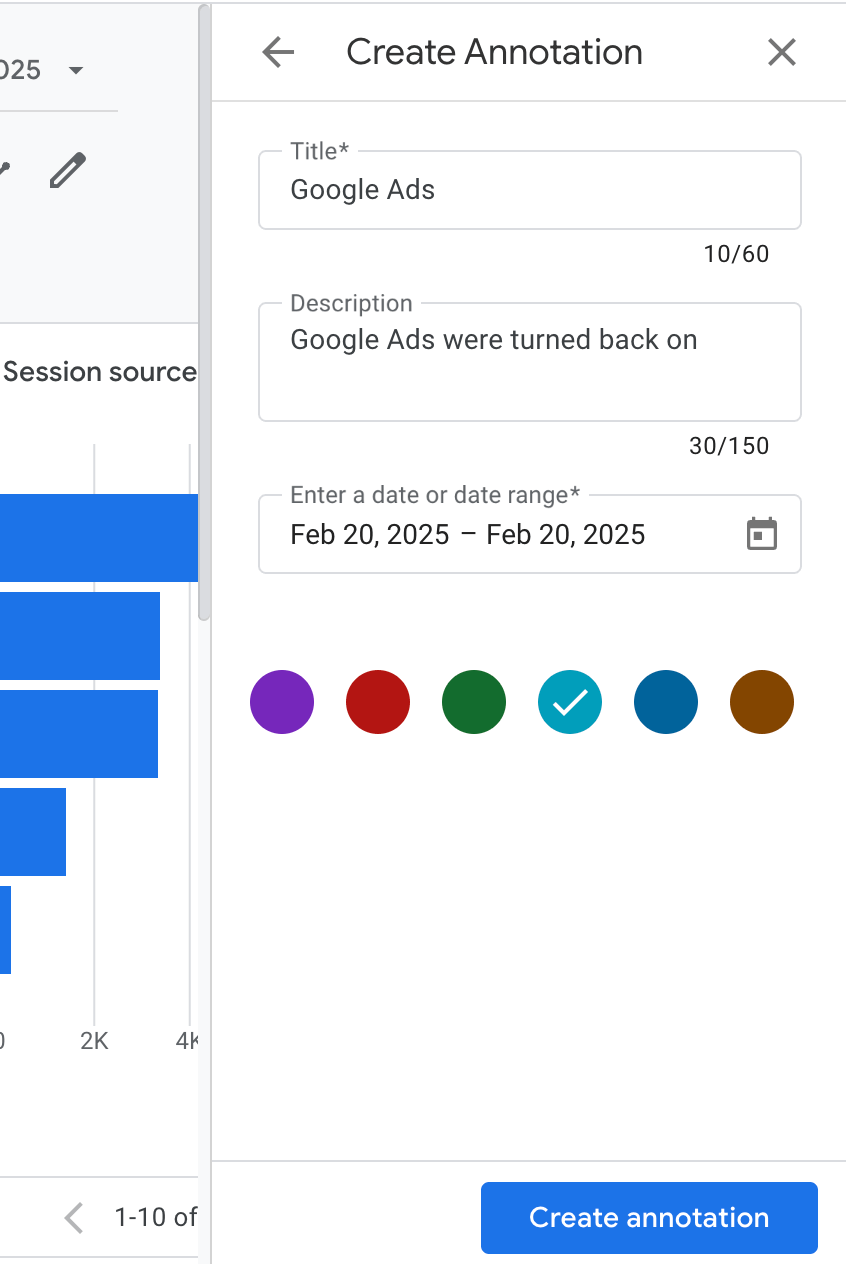
4. Add your annotation details: title (60-character limit); description (150); date or date range; color.
Now click Create annotation.
It will now show up on your Report below the line graph.

Do Annotations Apply To All Reports?
Yes, they do. Navigate to another report, and you’ll see the same annotation symbol as the one on the report you first annotated.

Edit Annotations in GA4
Make a mistake? Run out of annotations? Want to pick a different color?
Fear not. Editing annotations is easy.
1. Click an annotation symbol on the bottom of your chart…
…OR click the “View annotations” button above the chart.

Both options will open the right-side popout. Now click the annotation you want to edit.
The interface will now look the same as when you created the annotation, except it will say “Edit Annotation” at the top instead of “Create Annotation.”

- From here, you can edit any part of the annotation and click the blue “Update annotation” button when you’re finished.
Hide Annotations in GA4
If you want to turn off your annotations – I honestly can’t think of a good reason to do so, but it’s your dashboard! – when you’re in the annotations viewer (referenced earlier to edit annotations), click the settings cog near the bottom.
You’ll see an Annotation Settings box pop up on your screen.

The Hide annotations option will do exactly what it says. Click the button to move it to the right and Close the box.
Poof! No more visible annotations. (They’re not deleted, of course, just hidden.)
What if you click the Hide date range bars button?
If you add an annotation that spans multiple days instead of a single day, it will look like this. (You’ll notice that the horizontal bar behind the annotation isn’t visible in the above example when we only selected a single date.)

(Date ranges could be good to use for limited-time campaigns or tests. Or perhaps multi-day events that your team covers and could have a significant effect on traffic.)
So, again, when you click the Hide date range bars button, it will now look like this:

(It’s not automatic – you have to click “Close” – but I have the popup box and the removed bar in the same image for illustration purposes.)
Delete Annotations in GA4
If you ran into your limit, want to clean up your charts visually or just want to get rid of an old annotation, it’s easy to do.
As we mentioned above to edit annotations, click on an annotation in your chart or the View Annotations button, then click on the annotation you want to delete in the right popout.

Click the trash can symbol at the bottom of the Edit Annotation box.

You’ll then be asked to confirm the deletion.

Now, your annotation is gone. If you want to bring it back, you’ll have to start from scratch and add it again.
SIGN UP: Digital Strategy Newsletter
Now you’re all set with annotations!
What are you going to annotate? What questions do you have?
Comment below and let me know.
Leave a Reply