Google Analytics 4 provides information on the city and state from which users are visiting your website.
Let’s say you run a hyperlocal news website in Santa Monica, Calif., that sells subscriptions. You’ll probably want to focus on readers who live in or near your coverage area. Even if you get visits from other parts of the country/world, they’re not as likely to pay for your news.
Learn More About My GA4 Course
Or perhaps you’re an online store that also has a brick-and-mortar in Santa Monica. If sales tend to be higher in person than online, you’re going to want to reach users who are closest to your store.
SIGN UP: Digital Content Strategy Newsletter
But before doing a deep analysis, you need to know how many users are visiting your site from Santa Monica, and other relevant nearby areas. Then you can drill down even further to figure out how to draw them to your website and store to make purchases.
Here’s how to analyze traffic by city and state/region in Google Analytics 4.
Contents
2. Google Analytics 4 Traffic by City, State: Detailed Explanation
Google Analytics 4 Traffic by City, State: Summary
Reports Dashboard
Go to Reports > Users > Demographics overview and click on “View countries.”
Add a comparison specifying the city and/or state by which you want to filter your data.
Add a secondary dimension in the table to further filter and organize your data.
Explore Dashboard
Go to the Explore tab and open an existing exploration or create a new one.
Add the City and Region dimensions to your Dimensions section in the Variables tab.

Add the City and/or Region to your Rows or Columns in your Settings tab.
Also Read: How To Install Google Analytics 4
Google Analytics 4 Traffic by City, State: Detailed Explanation
City, State in GA4 Reports Dashboard
Go to Reports > Users > Demographics overview.
By default, the first widget you will see on this dashboard sorts traffic by country. This can be useful if you’re an international publication or have clients all over the world. Otherwise, you’ll want a more detailed look at your readers’ locations.

Click on “View countries,” and you’ll be brought to a Demographic details report page.
Note: Google Analytics 4 provides user location data based on the location of the user’s IP address on their particular device. This does not necessarily show you where people live – GA4 doesn’t provide that data – but rather where they were when they accessed your site.
GA4 Traffic by State: Reports Dashboard

1. Click Add comparison, which will initiate the Build comparison pop-out you see on the right in the screenshot above.
2. Under “Include,” select region, which is the equivalent of “State” in the United States, as well as most other countries.
3. Click the Dimension values dropdown, where you will see a list of all the states (regions) from which your site has received traffic in the specified time range. If there are a lot of options, you may be better off typing the state name and selecting it instead of scrolling through the entire list.
You can select multiple states if you wish.
4. Once you have selected the desired state, click OK, then the Apply button, which will now turn blue, at the bottom right.
You will now see a side-by-site comparison of All Users and California (or whatever state(s) you selected) users, side-by-side.

Again, if you don’t have a lot of international readers or customers, you may not be interested in analyzing traffic from “All Users.” Simply click the X next to the All Users comparison at the top, and you’ll be left with only the users in the states you selected.

GA4 Traffic by City: Reports Dashboard
Now that you have filtered traffic by a single (or few) state(s), you’re ready to drill down by city.
If you’re interested in analyzing traffic from just one particular city, or a small number of cities, you could use the same process as above for states, except you would include “City” in the first dropdown instead of “Region.”
But perhaps you want to see a list of all the cities in a specific region from which users and sessions come to your website. In that case, we’re going to pick up where we left off, filtering traffic only by California users.
Scroll down to the table, and you’ll see that there’s only one row of data for United States users. Click the dropdown where it says “Country” and change to “Region.”
We’ll still only see readers from California, but now it’s more clear instead of saying “United States.”

If you’re only filtering traffic by one region, this step isn’t necessary and you can change the dropdown to “City” instead of “Region.” I’m including this step here in case you want to filter by multiple states, and therefore see which cities correspond to which states.
Click the + symbol next to Region in the dropdown menu you just changed, and you’ll see a similar dropdown. Select “City.” I also like to expand the visible rows to more than 10, which allows you to see a large list of data without having to click through the list 10 at a time.

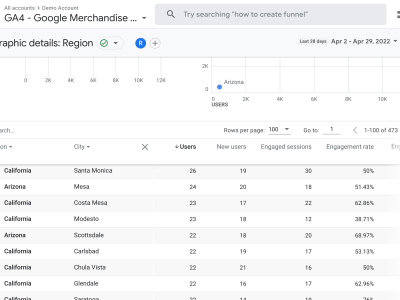
Here’s what that would look like if you added a second state, as I have now with Arizona, to make it easier to know which city corresponds to which state:

Now you can see just how many users and sessions come to your website from a particular city and state.
Is there another way you would like to analyze your data geographically? Let me know in the comments.
Also read: How To Create a Google Analytics 4 Landing Page Report
Leave a Reply